Moving Average Convergence Divergence (MACD): A Practical Guide
The Moving Average Convergence Divergence (MACD) is one of the most popular momentum indicators used by traders and analysts across markets. It’s simple to calculate, versatile in interpretation, and helpful for spotting trend direction, strength, and potential reversals. This post explains how MACD works, how to read it, common setups, practical tips, and pitfalls to watch out for.
What is MACD and how is it calculated?
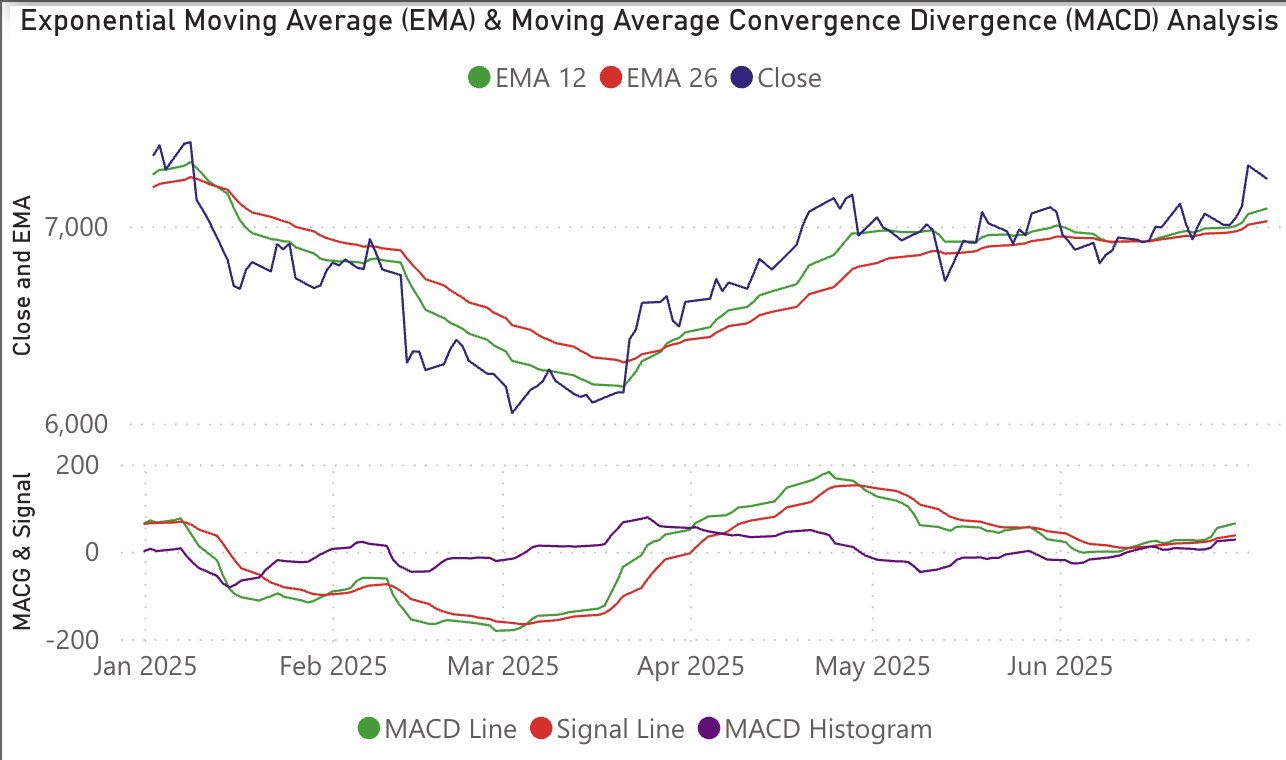
MACD is derived from two exponential moving averages (EMAs) of the price — typically the 12-period and 26-period EMAs — and a signal line which is the 9-period EMA of the MACD line. The core components are:
- MACD Line = 12-period EMA − 26-period EMA.
- Signal Line = 9-period EMA of the MACD Line.
- MACD Histogram = MACD Line − Signal Line.
The MACD Line measures the difference between shorter-term and longer-term momentum; the Signal Line smooths that difference and serves as a trigger for signals. The Histogram visually shows the distance between the MACD and signal lines and is useful to measure acceleration or deceleration in momentum.
Common interpretations
1. Crossovers
The most straightforward signals come from crossovers:
- Bullish crossover: MACD Line crosses above the Signal Line — potential buy timing.
- Bearish crossover: MACD Line crosses below the Signal Line — potential sell timing.
2. Zero line cross
When the MACD Line crosses above zero, the shorter EMA becomes greater than the longer EMA — signaling bullish momentum. Crossing below zero signals bearish momentum. Zero-line crosses tend to lag but confirm trend changes.
3. Divergence
Divergence between price and MACD is a strong warning sign:
- Bullish divergence: Price makes lower lows while MACD forms higher lows — possible upcoming reversal to the upside.
- Bearish divergence: Price makes higher highs while MACD forms lower highs — suggests momentum is weakening and a downside reversal may follow.
Practical setups and examples
Standard settings (12, 26, 9) are widely used and a good starting point for daily charts. For shorter timeframes (intraday), traders often use faster EMAs such as (6,13,5). Longer-term investors may use slower settings like (19,39,9) to reduce noise.
Using MACD with trend
In a clear uptrend, favor bullish crossovers and use pullbacks near support as entry points. In a downtrend, prefer bearish crossovers or failures at resistance. The MACD histogram turning from negative to positive during an uptrend is often the earliest sign of renewed strength.
Combining MACD with moving averages and volume
A common approach is to combine MACD signals with a trend filter such as a 50- or 200-period SMA: only take bullish MACD signals when price is above the SMA, and only take bearish signals when price is below. Volume spikes on crossovers or divergence breakouts add confirmation and improve the reliability of the trade.
Using MACD on Nifty 50 or large-cap stocks
For indexes and large-cap stocks (like Nifty 50 constituents), MACD is often less noisy because of smoother price action. Use daily or weekly MACD for swing trades and position trades. Pay attention to macro events and earnings that can create sudden momentum shifts — MACD will reflect them but may lag; use price action and support/resistance for risk control.
Common mistakes and limitations
1. Lagging nature: MACD uses moving averages, so it’s inherently lagging. Crossovers can occur after a large portion of a move has already happened.
2. False signals in choppy markets: During sideways markets, MACD crossovers and divergences can produce many false signals. Use trend filters or higher timeframes to avoid noise.
3. Overreliance on single signals: Always combine MACD with other technical tools (price action, support/resistance, volume) and risk management (position sizing, stop-losses).
Advanced tips
1. Use the histogram for early exits — shrinking histogram bars after a peak indicate fading momentum; consider reducing exposure even if crossovers haven’t occurred yet.
2. Multiple timeframe confirmation — a bullish signal on daily and weekly charts provides stronger conviction than on only one timeframe.
3. Customize settings to your style — faster traders can tighten EMAs, swing traders can stick with defaults, and investors can slow them down. Backtest your chosen settings on Nifty 50 historical data before relying on them live.
This article is educational and does not constitute financial advice. Always do your own research and consider consulting a qualified financial professional before making investment decisions.
Here is a interactive dashboard for free for nifty 50 stock technical analysis